Álvaro Ramírez
fitbit API, org babel, and gnuplot
Retook running recently. Took the dust off my aria scale and used the opportunity to check out fitbit's API.
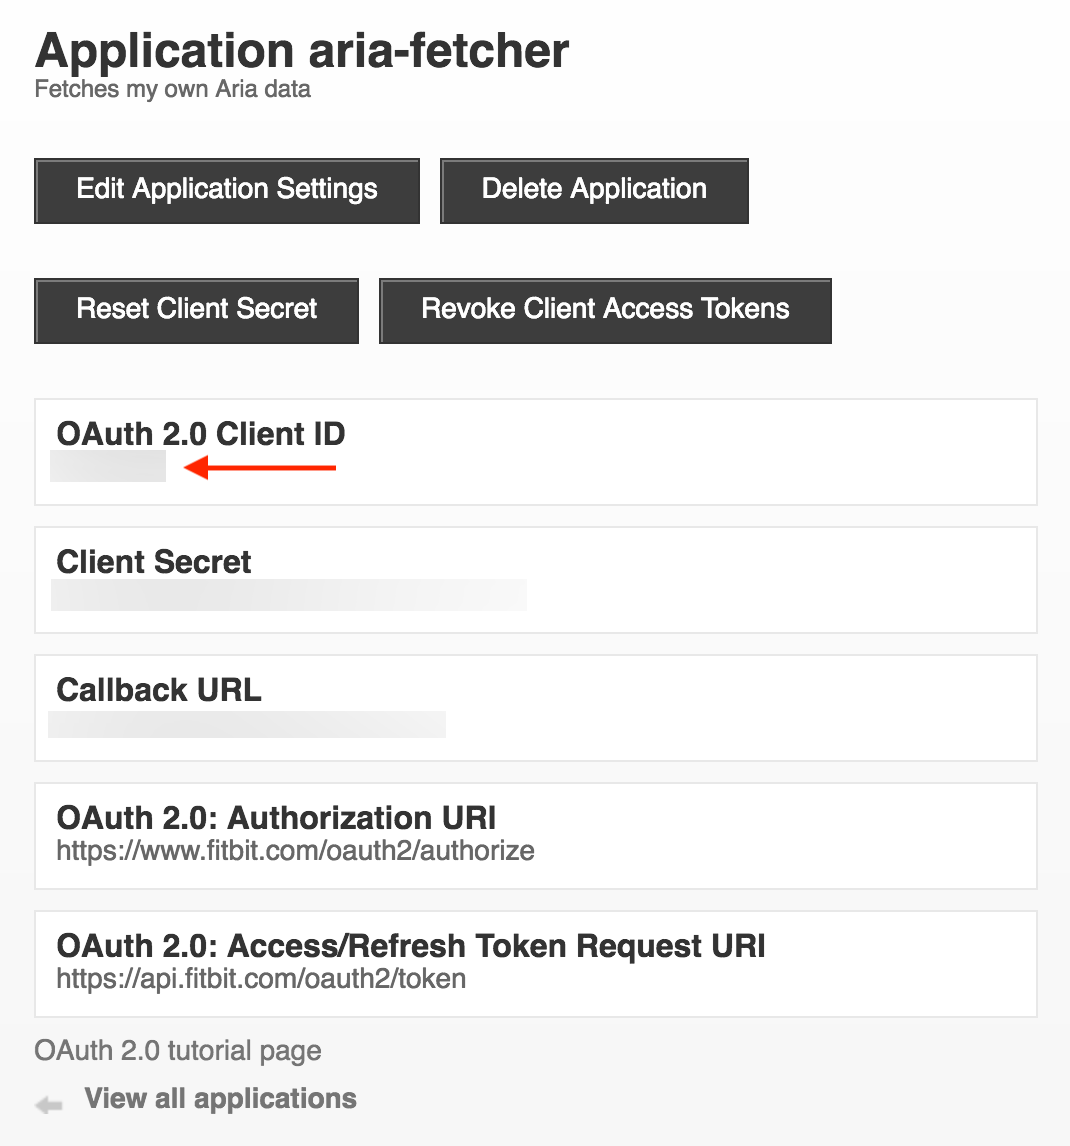
First register your app at dev.fitbit.com/apps/new and get a client_id=AABBCC.
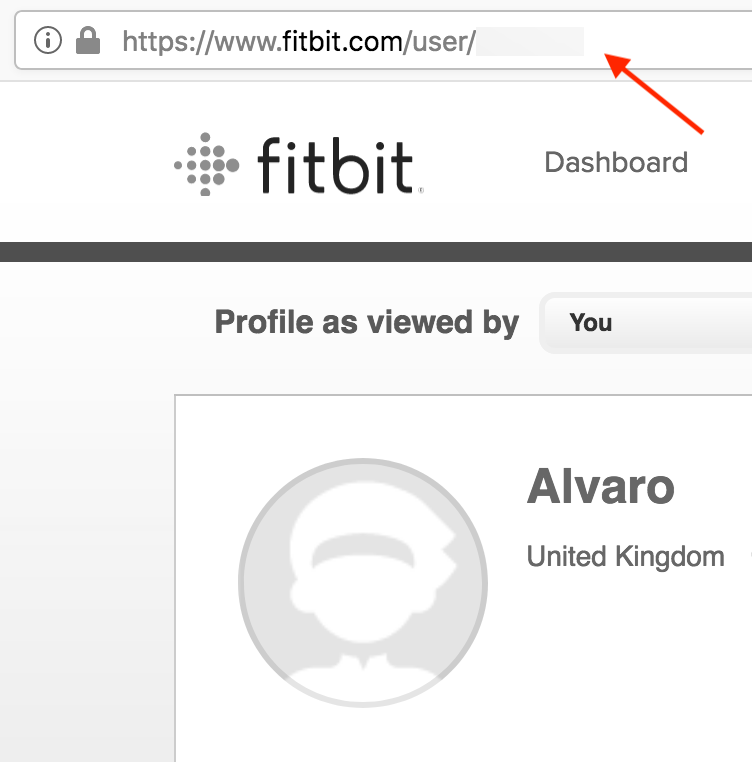
You'll also need your USER_ID, from your Fitbitx user profile.
We'll also need a token. I used the implicit grant flow URL in my browser and extracted access_token=TOKEN.
Now let's wire up two org source blocks to fetch the data and subsequently plot using gnuplot.
It's pretty neat. You can take the output from one source block and use it as input to another.
We use curl to fetch data from fitbit's API and pipe through jq and sed to massage the output format into two columns.
Note: Before using gnuplot in org babel, you'll need to install the gnuplot package and add to babel languages.
(use-package gnuplot :ensure t)

(use-package ob
  :config
  (org-babel-do-load-languages
   'org-babel-load-languages
   '((gnuplot . t))))
curl -s -H "Authorization: Bearer TOKEN" https://api.fitbit.com/1/user/USER_ID/body/weight/date/2018-06-09/2018-07-11.json | jq '.[][] | "\(.dateTime) \(.value)"' | sed 's/"//g'
| 2018-06-09 | 65.753 |
| 2018-06-10 | 65.762 |
| 2018-06-11 | 65.771 |
| 2018-06-12 | 65.78 |
| 2018-06-13 | 65.789 |
| 2018-06-14 | 65.798 |
| 2018-06-15 | 65.807 |
| 2018-06-16 | 65.816 |
| 2018-06-17 | 65.825 |
| 2018-06-18 | 65.85 |
| 2018-06-19 | 65.96 |
| 2018-06-20 | 64.1 |
| 2018-06-21 | 65.64 |
| 2018-06-22 | 65.47 |
| 2018-06-23 | 65.515 |
| 2018-06-24 | 65.56 |
| 2018-06-25 | 65.605 |
| 2018-06-26 | 65.65 |
| 2018-06-27 | 65.18 |
| 2018-06-28 | 64.49 |
| 2018-06-29 | 64.49 |
| 2018-06-30 | 64.41 |
| 2018-07-01 | 64.33 |
| 2018-07-02 | 64.25 |
| 2018-07-03 | 64.17 |
| 2018-07-04 | 64.55 |
| 2018-07-05 | 64.39 |
| 2018-07-06 | 64.33 |
| 2018-07-07 | 65.06 |
| 2018-07-08 | 63.28 |
| 2018-07-09 | 63.4 |
| 2018-07-10 | 64.22 |
| 2018-07-11 | 63.95 |
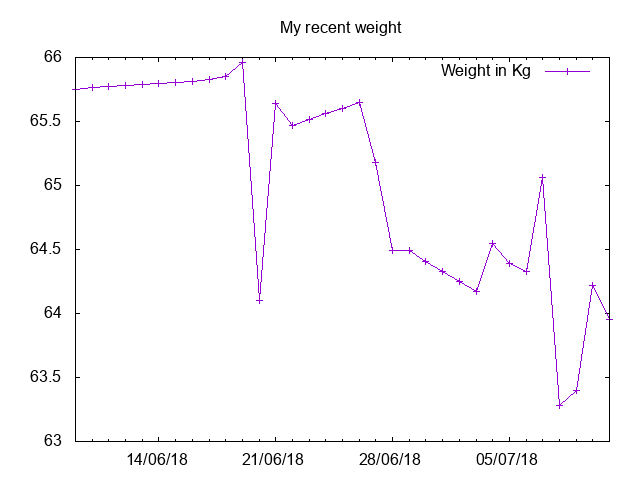
Now feed the two column data to gnuplot.
reset
set title "My recent weight"
set xdata time
set timefmt '%Y-%m-%d'
set format x "%d/%m/%y"
set term png
set xrange ['2018-06-09':'2018-07-11']
plot data u 1:2 with linespoints title 'Weight in Kg'
Fetching data and plotting through org babel and gnuplot is pretty sweet. I've barely scratched the surface. There's more at Org-babel-gnuplot and Plotting tables in Org-Mode using org-plot. Either way, this is another Emacs super power to keep in the toolbox.